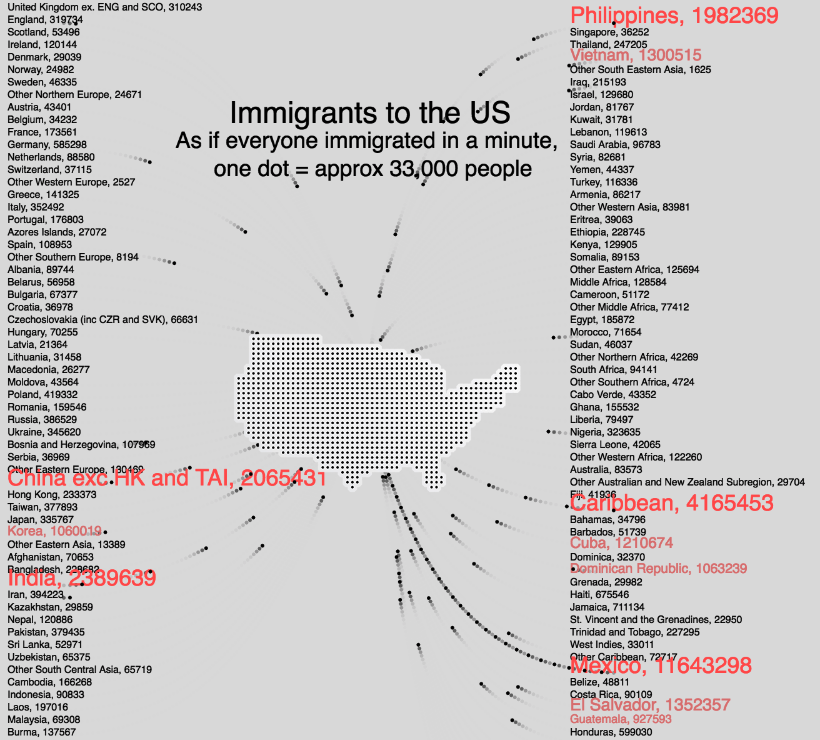
I really wanted to create a moving visual for this data set, as it relates to literal movement, as well as ‘individualize’ the numbers, as it relates to individuals. It is also temporal data, even though no temporal data is in the data set, so I sought to create temporal meaning. Not everyone moves simultaneously, they move over the course of a year, or years. In a continuous ever-changing stream.
My first data visualizations showed the numbers as static large pieces. Which does help to understand quickly which are the most prominent places, but I think while I should incorporate elements from those into later designs, I shouldn’t use all the elements. Movement is much nicer the heaviness - in this circumstance.


