Performing Data on the Internet

For our Performing the Internet final, Dom Chang and I worked together to build an interactive piece that can be performed live. It expands on his conceptual piece that asks the audience a series of yes/no questions, developing it into a much more complete experience.

We worked together to outline the experience, using the data to show colors play sounds on decentralized devices. I focused mostly on creating the interface for the questionnaire, while Dom focused more on the server side stuff, which was also overlapping with his Live Web class. So we had good overlap with other classes. I had a delight in learning HTML and CSS more completely, as well as using Jquery listen to modify the page. Check out the complete code here (it says PTI final but they’re the same project)!

Screen Shot 2018-12-10 at 1.10.17 PM.png

Dead Languages

For this project, my partners Keerthana, Hadar, and myself chose to look at extinct languages. Wikipedia has a great list here. The assignment was for mapping, and as these languages were from all across the globe, we figured it would be an interesting and appropriate task.

After we cleaned the data - reducing and converting times such as Dec 6 2016, and mid-1900’s, to a single year - we had a nice list from which to build some visuals. This would help us understand what we were really working with. This is what we came up with:

This shows clearly that the US leads the race - from the data we have at our disposal. There are a number of ways to go from here, represent the data with an icon to show the death, add lines to make the data more legible. Put it on a map. Put it on…

This shows clearly that the US leads the race - from the data we have at our disposal. There are a number of ways to go from here, represent the data with an icon to show the death, add lines to make the data more legible. Put it on a map. Put it on a map that changes over time. And so forth. Source code here

We had a great time working on this, but boy does working with data take some time! We definitely want to develop this concept further. Especially looking into completing, or at least getting some verification on our data set itself. That is one aspect of this project that was eye opening, is the research aspect involved. Data sets cannot be trusted in and of themselves, and necessarily require intense verification. This we did not do, as we were concerned with getting to square one - which again, took quite a while, but was fun! And we learned a lot. Which is always the most important thing, especially while in school.

Archival Project

For this project I had a hard time finding usable data for climate - what I really want to work on - and instead used compared text transcripts of speeches between Barack Obama and Donald Trump.

This is initially due to the fact that I had downloaded their speeches to text files* from The MIller Center for my Pop-Up Windows initial concepts

* Barack Obama Donald Trump

I was then inspired by a Making Media Making Devices class to use python to resolve my initial parsing of the content. I had wanted to use python for some time, and it turned out to be remarkably simple!

This code allowed me to open the whole text, split into lines, then into words, strip white space, check if it’s longer than a certain length, push it to a new array of words, capitalize them for consistency, convert it into a set reduced to unique entries, and finally find overlap between each set and remove it from each set of words.

from collections import Counter
import csv

rawDataDT = []

longestWord = 11

with open('dt2.txt','r') as f:
    for line in f:
        for word in line.split():
           word.strip();

           if len(word) >= longestWord:
               rawDataDT.append(word)
           else:
               pass

cap_wordsDT = [word.upper() for word in rawDataDT]

wordsCondensedDT = set(cap_wordsDT)

rawDataBO = []

with open('bo.txt','r') as f:
    for line in f:
        for word in line.split():
            word.strip()
            if len(word) >= longestWord:
                rawDataBO.append(word)
            else:
                pass


cap_wordsBO = [word.upper() for word in rawDataBO]

wordsCondensedBO = set(cap_wordsBO)

overlap = wordsCondensedBO.intersection(wordsCondensedDT)
uniquesDT = str(wordsCondensedDT.difference(overlap))
uniquesBO = str(wordsCondensedBO.difference(overlap))

print('///////////////////////////////////\
////////////////////////////////////')

f = open('dt-uniques.txt','w')
f2 = open('bo-uniques.txt','w')
f.write(uniquesDT)
f2.write(uniquesBO)
f.close()
f2.close()

This left me with a truly unique set of terms for each president gathered from a random sampling of around 50 thousand words. From here we can see what kind of people they really are.

Screen Shot 2018-10-15 at 9.42.06 PM.png
obama-trump.png

After printing a bunch of examples to the console, and making fun art sketches, I was struck with the fact that python put quotes around each entry, and didn’t remove punctuation. This was something I needed to resolve, and I figured google sheets would be the easiest for this form of manual manipulation.

First of all - quite obviously Mr. Donald had a bunch of nonsensical entries that I had to omit. I can’t count such entries as ‘Bureaucrats-and’ or ‘Trump-there’ as a unique word. Of course, Obama had the occasional one as well, poor Donald’s run-on sentences hurt his total uniqueness here.

Then after removing extranneous characters, I had to again filter for uniques, which reduced each persons entry again. In the end I was left with 285 entries for the Don, and 435 for Barry.

I didn’t remove pluralization or variations, since I wasn’t sure where to draw the line. This might be an interesting next step.

I then output this data to a tsv and csv file (it took me a second to figure out how to output propery so that I could read the files in p5).

Next, I used some p5.js code to measure word count by starting letter for each person. It turns out, as I expected, Obama has a larger vocabulary. But their starting character word use follows a similar pattern, interestingly enough.

I probably should have used an object, but I was having trouble figuring out the proper syntax.

var tnbData;
var tWords = [];
var bWords = [];
var tVals = [];
var bVals = [];

function preload() {
  tnbData = loadJSON("tnb.json")
}

function setup() {
  createCanvas(500,500);
  background(20);
  textSize(7);
  textAlign(CENTER);
  noStroke();
  makeDicts();
  firstChars();
  pushChars();
  TrumpLines();
  ObamaLines();
  showWords();
  count()
}


function showWords() {
    setInterval(function(){
    var bI = int(random(bWords.length))+1
    var tI = int(random(tWords.length))+1

      var bWord = bWords[bI]
      var tWord = tWords[tI]
      push()
      fill(20)
      rect(0,0,500,100)
      textSize(40)
      textAlign(LEFT)
      fill(80,130,255,120)
      text(bWord,10,50)
      fill(255,50,150,120)
      text(tWord,10,90)
      pop();

  }, 2000);
}


function htmlElements(){

    let obamaTitle = createElement('h1', "OBAMA Words")

    for(var i = 0; i< bWords.length; i++) {
      let p = createElement('p', bWords[i],10)
    }

    let trumpTitle = createElement('h1', "TRUMP Words")

    for(var i = 0; i< tWords.length; i++) {
      let p = createElement('p', tWords[i],10)
    }

}

var baseline = 320;
var xOff = 25;

function ObamaLines(){

  var heightPrev;
  var xposPrev;

  for(var i = 0; i< bVals.length; i++) {
    fill(80,130,255,40)
    var xpos = (i * 15) + xOff
    var height = bVals[i]*(-3)
    rect(xpos, baseline, 10, height)
    fill(80,130,255,180)
    text(bVals[i],xpos+5,baseline+10)

    if(i>0){
      stroke(80,130,255,180)
      strokeWeight(4)
      line(xpos+5,height+baseline,xposPrev+5,heightPrev+baseline)
      noStroke()
    }
    heightPrev = height
    xposPrev = xpos
    }
  }

function TrumpLines(){
  var heightPrev;
  var xposPrev;
    for(var i = 0; i< tVals.length; i++) {
      fill(255,50,100,40)
      var xpos = (i * 15) + xOff
      var height = tVals[i]*(-3)
      rect(xpos, baseline, 10, height)
      fill(255,50,100,180)
      text(tVals[i],xpos+5, baseline+20)
        if(i>0){
          stroke(255,50,100,180)
          strokeWeight(4)
          line(xpos+5,height+baseline,xposPrev+5,heightPrev+baseline)
          noStroke()
        }
      heightPrev = height
      xposPrev = xpos
    }
}

function makeDicts(){
  for (var i = 0; i < 435; i++) {
    if (i < 285) {
      tWords.push(tnbData[i].TRUMP)
    }
    bWords.push(tnbData[i].OBAMA)

  }

  var dict = ['A','B','C','D','E','F','G','H','I','J','K','L','M','N','O','P','Q','R','S','T','U','V','W','X','Y','Z']

  dict.forEach(function (letter,i){
    var xPos = (i * 15) + xOff+5
    fill(200)
    text(letter,xPos, baseline+30)
  })
}

function firstChars(){
    tWords.forEach(function(word) {
      var string = word.toString();
      var firstchar = string.charAt(0);
      tIfs(firstchar)
    })

    bWords.forEach(function(word) {
      var string = word.toString();
      var firstchar = string.charAt(0);
      bIfs(firstchar);
    })
}

var bA=0
var bB=0
var bC=0
var bD=0
var bE=0
var bF=0
var bG=0
var bH=0
var bF=0
var bG=0
var bH=0
var bI=0
var bJ=0
var bK=0
var bL=0
var bM=0
var bN=0
var bO=0
var bP=0
var bQ=0
var bR=0
var bS=0
var bT=0
var bU=0
var bV=0
var bW=0
var bX=0
var bY=0
var bZ=0

var tA = 0
var tB  =   0
var tC  =   0
var tD  =   0
var tE  =   0
var tF  =   0
var tG  =   0
var tH  =   0
var tF  =   0
var tG  =   0
var tH  =   0
var tI  =   0
var tJ  =   0
var tK  =   0
var tL  =   0
var tM  =   0
var tN  =   0
var tO  =   0
var tP  =   0
var tQ  =   0
var tR  =   0
var tS  =   0
var tT  =   0
var tU  =   0
var tV  =   0
var tW  =   0
var tX  =   0
var tY  =   0
var tZ  =   0

function tIfs (firstchar){
  if (firstchar == 'A'){
      tA +=1
   }
   if (firstchar == 'B'){
     tB +=1
  }
  if (firstchar == 'C'){
    tC +=1
  }
  if (firstchar == 'D'){
    tD +=1
  }
  if (firstchar == 'E'){
    tE +=1
  }
  if (firstchar == 'F'){
    tF +=1
  }
  if (firstchar == 'G'){
    tG +=1
  }
  if (firstchar == 'H'){
    tH +=1
  }
  if (firstchar == 'I'){
    tI +=1
  }
  if (firstchar == 'J'){
    tJ +=1
  }
  if (firstchar == 'K'){
    tK +=1
  }
  if (firstchar == 'L'){
    tL +=1
  }
  if (firstchar == 'M'){
    tM +=1
  }
  if (firstchar == 'N'){
    tN +=1
  }
  if (firstchar == 'O'){
    tO +=1
  }
  if (firstchar == 'P'){
    tP +=1
  }
  if (firstchar == 'Q'){
    tQ +=1
  }
  if (firstchar == 'R'){
    tR +=1
  }
  if (firstchar == 'S'){
    tS +=1
  }
  if (firstchar == 'T'){
    tT +=1
  }
  if (firstchar == 'U'){
    tU +=1
  }
  if (firstchar == 'V'){
    tV +=1
  }
  if (firstchar == 'W'){
    tW +=1
  }
  if (firstchar == 'X'){
    tX +=1
  }
  if (firstchar == 'Y'){
    tY +=1
  }
  if (firstchar == 'Z'){
    tZ +=1
  }
}

function bIfs(firstchar){
  if (firstchar == 'A'){
      bA +=1
   }
   if (firstchar == 'B'){
     bB +=1
  }
  if (firstchar == 'C'){
    bC +=1
  }
  if (firstchar == 'D'){
    bD +=1
  }
  if (firstchar == 'E'){
    bE +=1
  }
  if (firstchar == 'F'){
    bF +=1
  }
  if (firstchar == 'G'){
    bG +=1
  }
  if (firstchar == 'H'){
    bH +=1
  }
  if (firstchar == 'I'){
    bI +=1
  }
  if (firstchar == 'J'){
    bJ +=1
  }
  if (firstchar == 'K'){
    bK +=1
  }
  if (firstchar == 'L'){
    bL +=1
  }
  if (firstchar == 'M'){
    bM +=1
  }
  if (firstchar == 'N'){
    bN +=1
  }
  if (firstchar == 'O'){
    bO +=1
  }
  if (firstchar == 'P'){
    bP +=1
  }
  if (firstchar == 'Q'){
    bQ +=1
  }
  if (firstchar == 'R'){
    bR +=1
  }
  if (firstchar == 'S'){
    bS +=1
  }
  if (firstchar == 'T'){
    bT +=1
  }
  if (firstchar == 'U'){
    bU +=1
  }
  if (firstchar == 'V'){
    bV +=1
  }
  if (firstchar == 'W'){
    bW +=1
  }
  if (firstchar == 'X'){
    bX +=1
  }
  if (firstchar == 'Y'){
    bY +=1
  }
  if (firstchar == 'Z'){
    bZ +=1
  }
}

function pushChars(){
  tVals.push(tA)
  tVals.push(tB)
  tVals.push(tC)
  tVals.push(tD)
  tVals.push(tE)
  tVals.push(tF)
  tVals.push(tG)
  tVals.push(tH)
  tVals.push(tI)
  tVals.push(tJ)
  tVals.push(tK)
  tVals.push(tL)
  tVals.push(tM)
  tVals.push(tN)
  tVals.push(tO)
  tVals.push(tP)
  tVals.push(tQ)
  tVals.push(tR)
  tVals.push(tS)
  tVals.push(tT)
  tVals.push(tU)
  tVals.push(tV)
  tVals.push(tW)
  tVals.push(tX)
  tVals.push(tY)
  tVals.push(tZ)

  bVals.push(bA)
  bVals.push(bB)
  bVals.push(bC)
  bVals.push(bD)
  bVals.push(bE)
  bVals.push(bF)
  bVals.push(bG)
  bVals.push(bH)
  bVals.push(bI)
  bVals.push(bJ)
  bVals.push(bK)
  bVals.push(bL)
  bVals.push(bM)
  bVals.push(bN)
  bVals.push(bO)
  bVals.push(bP)
  bVals.push(bQ)
  bVals.push(bR)
  bVals.push(bS)
  bVals.push(bT)
  bVals.push(bU)
  bVals.push(bV)
  bVals.push(bW)
  bVals.push(bX)
  bVals.push(bY)
  bVals.push(bZ)
}

function count() {
  var  tAmount = tWords.length
  var  bAmount = bWords.length
  var  tVal = tAmount.toString()
  var  bVal = bAmount.toString()
  fill(255,50,150,120)
  textSize(24)
  text (tAmount,450,baseline + 20)
  fill(80,130,255,120)
  text(bAmount,450,baseline)
}
Simple Bar graph to visualize the data. This was a little confusing as far as the curve is concerned though.

Simple Bar graph to visualize the data. This was a little confusing as far as the curve is concerned though.

So I connected the peaks with lines counted each entry, and added letters for clarity.

So I connected the peaks with lines counted each entry, and added letters for clarity.

As you can see the curves are similar, with early letters and particularly C the highest for both, as well the later grouping of P, R, S, & T. I’d have thought Trumps G words would be more unique, but he just uses common words a lot apparently.

It also struck me that after T, trump has a total of 1 unique entry, for V, while Obama has 27. for U, V, W, and Y. To me this is yet another example of the eloquence we’ve lost, and the marketing we’ve gained.

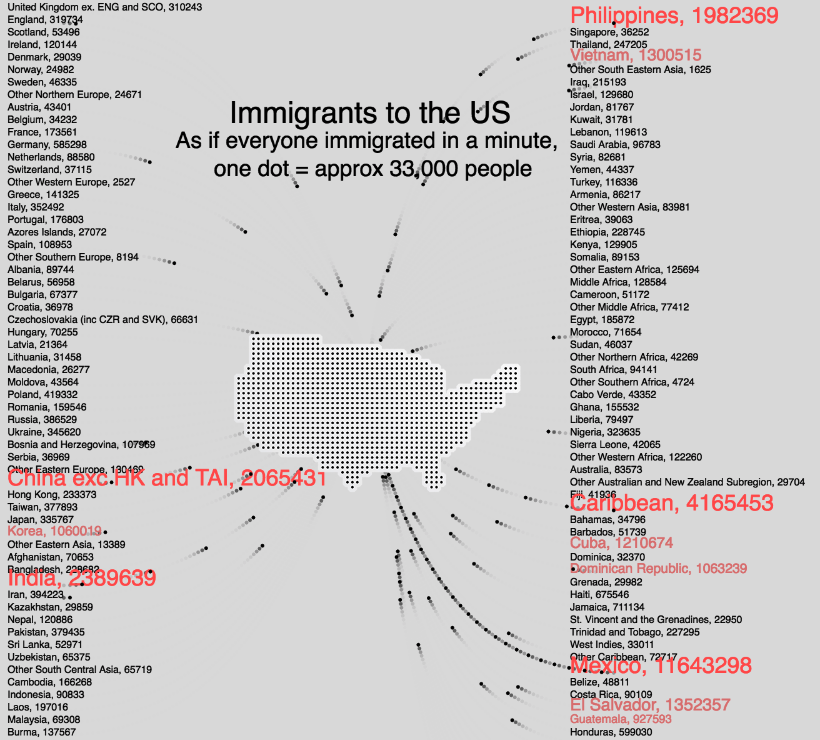
Immigrants to the U.S.

I really wanted to create a moving visual for this data set, as it relates to literal movement, as well as ‘individualize’ the numbers, as it relates to individuals. It is also temporal data, even though no temporal data is in the data set, so I sought to create temporal meaning. Not everyone moves simultaneously, they move over the course of a year, or years. In a continuous ever-changing stream.

My first data visualizations showed the numbers as static large pieces. Which does help to understand quickly which are the most prominent places, but I think while I should incorporate elements from those into later designs, I shouldn’t use all the elements. Movement is much nicer the heaviness - in this circumstance.

Screen Shot 2018-09-11 at 3.17.02 PM.png

Screen Shot 2018-09-07 at 8.09.17 PM.png